ARTÍCULO
Low levels of allozyme variation in the southern populations of the Korean endemic shrub Sophora koreensis (Fabaceae): Implications for conservation
M. Y. CHUNG (정미윤) & M. G. CHUNG (정명기)
Division of Life Science and the Research Institute of Natural Science, Gyeongsang National University, KR-52828 Jinju, Republic of Korea
ORCID iD: M. Y. CHUNG (정미윤): http://orcid.org/0000-0002-8756-5367
M. G. CHUNG (정명기): http://orcid.org/0000-0002-1283-3574
Author for correspondence: M. G. Chung (mgchung@gnu.ac.kr)
Editor: J. López-Pujol
ABSTRACT
Low levels of allozyme variation in the southern populations of the Korean endemic shrub Sophora koreensis (Fabaceae): Implications for conservation.— We investigated allozyme variation of the rare shrub Sophora koreensis in Yanggu County (South Korea), at the southern margin of the species range. To gain insights into ecological processes at the landscape level, we studied two or three populations from four localities (in total, 10 populations) in a range of ca. 6 km. We found low levels of within-population genetic variation (%P = 13.6, A = 1.14, and He = 0.026) and a moderate degree of among-population genetic differentiation (FST = 0.203). The analysis of molecular variance (AMOVA) revealed a substantially higher percentage of variation among populations within localities (17%) than among localities (5%). There was no significant relationship between pairwise genetic divergence and logarithm of pairwise geographic distance (r = 0.032, P = 0.842). These results suggest limited gene flow between populations within localities, while indicating that the optimal strategy for the preservation of the genetic variation of S. koreensis is to conserve as many populations as possible.
KEY WORDS: allozymes; conservation; genetic diversity; Korea; Sophora koreensis.
Bajos niveles de variación isoenzimática en las poblaciones sureñas del arbusto endémico de Corea Sophora koreensis (Fabaceae): Implicaciones para su conservación
RESUMEN
Bajos niveles de variación isoenzimática en las poblaciones sureñas del arbusto endémico de Corea Sophora koreensis (Fabaceae): Implicaciones para su conservación.— Se investigó la variación isoenzimática del arbusto raro Sophora koreensis en el condado de Yanggu (Corea del Sur), en el extremo sur de su área de distribución. Para obtener información sobre los procesos ecológicos a nivel del paisaje, se estudiaron dos o tres poblaciones para cada una de las cuatro localidades (en total, 10 poblaciones) en un radio de unos 6 km. Se encontraron bajos niveles de variación genética intra-poblacional (%P = 13,6, A = 1,14 y He = 0,026) y un grado moderado de diferenciación genética entre poblaciones (FST = 0,203). El análisis de la varianza molecular (AMOVA) reveló un porcentaje sustancialmente mayor de variación entre poblaciones dentro cada una de las localidades (17%) que entre localidades (5%). No hubo una relación significativa entre la divergencia genética y el logaritmo de la distancia geográfica entre pares de poblaciones (r = 0,032, P = 0,842). Estos resultados sugieren un flujo genético limitado entre poblaciones dentro de las localidades, además de indicar que la mejor estrategia para la preservación de la diversidad genética de S. koreensis es la conservación del máximo número de poblaciones posible.
PALABRAS CLAVE: conservación; Corea; diversidad genética; isoenzimas; Sophora koreensis.
적요
한국특산식물인 개느삼(콩과식물)의 남쪽 분포역에서 낮은 수준의 알로자임 변이: 보전에 대한 암시.— 저자들은 한국 양구군의 희귀한 관목인 개느삼의 알로자임 변이를 조사하였다. 경관 수준에서 생태학적 과정에 대한 통찰을 얻기 위해, 저자들은 약 6km의 범위에서 4 곳의 리(시골 마을 지역) 각각에 2 ~ 3 집단을(총 10 명의 집단) 조사하였다. 자자들은 낮은 수준의 집단 내 유전적변이 수준을 파악하였으며 (% P = 13.6, A = 1.14, He = 0.026) 중간 수준의 집단 간 유전적 분화 정도를 구하였다(FST = 0.203). 분자분산분석(AMOVA)은 4 곳 지역 간 변이(5 %)보다 지역 내 매우 인접된 집단 간 변이(17%)가 훨씬 높았다. 집단 간 유전적 분기 쌍과 로그 지리적 거리 쌍 간에는 통계학적으로 유의한 상관관계가 없었다(r = 0.032, P = 0.842). 이러한 결과는 지역 내 개체군간에 제한된 유전자 흐름을 암시하며 개느삼의 유전적 변이를 보존하기 위한 최적의 전략은 최대한 많은 집단 수를 보존하는 것이라고 지적하고 있다.
주요어: 알로자임; 보전; 유전적 다양성; 한국; 개느삼.
Recibido: 19/12/2016 / Aceptado: 09/01/2017 / Publicado on line: 23/02/2017
Cómo citar este artículo / Citation: Chung, M. Y. & Chung, M. G. 2017. Low levels of allozyme variation in the southern populations of the Korean endemic shrub Sophora koreensis (Fabaceae): Implications for conservation. Collectanea Botanica 36: e006. doi: http://dx.doi.org/10.3989/collectbot.2017.v36.006
Copyright: © 2017 Institut Botànic de Barcelona (CSIC). This is an open-access article distributed under the terms of the Creative Commons Attribution License (CC BY) Spain 3.0.
CONTENIDOS
INTRODUCTIONTop
Sophora koreensis Nakai (Fabaceae), endemic to the Korean Peninsula, is a deciduous broad-leaved small shrub (less than 1 m tall) narrowly distributed on lower mountain hillsides (altitude ca. 150–650 m above sea level). The species reproduces both sexually and vegetatively via rhizomes. Until recently it was included in its own genus, Echinosophora Nakai (Lee, 1996Lee, W. T. 1996. 한국식물명고 [Standard illustrations of Korean plants]. Academy Publishing Co., Seoul [in Korean].; Lee et al., 2004Lee, W. K., Toru, T. & Heo, K. 2004. Molecular evidence for inclusion of the Korean endemic genus “Echinosophora” in Sophora (Fabaceae), and embryological features of the genus. Journal of Plant Research 117: 209–219. https://doi.org/10.1007/s10265-004-0150-x). In North Korea (the Democratic People’s Republic of Korea, hereafter the “DRPK”), about 11 localities are known in one city and four counties (Ra et al., 2005Ra, U. C., Park, H.-S., Ju, I.-Y. et al. 2005. Red data book of DPR Korea (plant). MAB National Committee of DPR Korea, Botanical Institute, Biological Branch, Academy of Sciences, Pyongyang. ; Chang et al., 2016Chang, C. S., Kim, H., Son, S. & Kim, Y.-S. 2016. The Red list of selected vascular plants in Korea. Korea National Arboretum and Korean Plant Specialist Group, Pocheon.; Fig. 1), whereas in South Korea (the Republic of Korea, hereafter the “ROK”), up to 16 localities have been found to date in one city and four counties, all in Kangwon Province (Cheon et al., 2009Cheon, K.-S., Jang, S.-K., Lee, W.-T. & Yoo, K.-O. 2009. 개느삼의 분포와 자생지 환경특성 [The natural habitat and distribution of Echinosophora koreensis (Nakai) Nakai in Korea]. Korean Journal of Plant Taxonomy 39: 254–263 [in Korean]., and the present study; Fig. 1). In 1992 the ROK government designated two of the localities (HAN, Hanjeon Rural village, and YIM, Imdang Rural village; Fig. 1) as National Monument of ROK No. 372, in order to preserve and protect those areas (Yim, 1993Yim, K.-B. 1993. 천연기념물: 식물편 [Botanical treasures (natural monuments) of Korea]. Daewonsa, Seoul [in Korean].).
In ROK, the number of shoots in each population is on the order of tens to hundreds (Kim et al., 2016Kim, Y.-S., Kim, H. & Son, S.-W. 2016. Sophora koreensis. The IUCN Red List of Threatened Species 2016: e.T13188557A13189529. Retrieved December 5, 2016, from https://doi.org/10.2305/IUCN.UK.2016-1.RLTS.T13188557A13189529.en; J. M. Chung, pers. comm.). Owing to the species’ limited distribution and endemic nature, S. koreensis has been assessed by several authors and authorities in ROK following the criteria of the IUCN (International Union for Conservation of Nature) Red List Categories (IUCN, 2001IUCN (International Union for Conservation of Nature) 2001. IUCN Red List Categories: Version 3.1. IUCN, Gland & Cambridge. ). However, the survey results were inconsistent: “Vulnerable” [VU B2ab (Chang et al., 2005Chang, C. S., Lee, H. S., Park, T. Y. & Kim, H. 2005. IUCN 적색목록 기준에 의한 환경부 멸종위기 야생식물종에 대한 평가 [Reconsideration of rare and endangered plant species in Korea based on the IUCN red list categories]. Korean Journal of Ecology 28: 305–320 [in Korean]. https://doi.org/10.5141/JEFB.2005.28.5.305); VU B2ab(iii, iv) (MOE, 2012MOE (Ministry of Environment, Republic of Korea) 2012. 한국의 멸종위기 야생동∙식물 적색자료집 관속식물 [Red data book of endangered vascular plants in Korea]. National Institute of Biological Resources, Incheon [in Korean].)] or “Endangered” [EN B1ab(iii)+2ab(iii) (Chang et al., 2016Chang, C. S., Kim, H., Son, S. & Kim, Y.-S. 2016. The Red list of selected vascular plants in Korea. Korea National Arboretum and Korean Plant Specialist Group, Pocheon.; Kim et al., 2016Kim, Y.-S., Kim, H. & Son, S.-W. 2016. Sophora koreensis. The IUCN Red List of Threatened Species 2016: e.T13188557A13189529. Retrieved December 5, 2016, from https://doi.org/10.2305/IUCN.UK.2016-1.RLTS.T13188557A13189529.en)]. Sophora koreensis had been included in ROK’s official listing of special protection of endangered wild plants (the 2nd grade) until 2012 (MOE, 2012MOE (Ministry of Environment, Republic of Korea) 2012. 한국의 멸종위기 야생동∙식물 적색자료집 관속식물 [Red data book of endangered vascular plants in Korea]. National Institute of Biological Resources, Incheon [in Korean].), when it was delisted without providing any scientific justification (Kim et al., 2016Kim, Y.-S., Kim, H. & Son, S.-W. 2016. Sophora koreensis. The IUCN Red List of Threatened Species 2016: e.T13188557A13189529. Retrieved December 5, 2016, from https://doi.org/10.2305/IUCN.UK.2016-1.RLTS.T13188557A13189529.en). For further information on ecology and conservation status, we suggest referring Kim et al. (2016Kim, Y.-S., Kim, H. & Son, S.-W. 2016. Sophora koreensis. The IUCN Red List of Threatened Species 2016: e.T13188557A13189529. Retrieved December 5, 2016, from https://doi.org/10.2305/IUCN.UK.2016-1.RLTS.T13188557A13189529.en).
Given its threatened status and the lack of current conservation measures (Kim et al., 2016Kim, Y.-S., Kim, H. & Son, S.-W. 2016. Sophora koreensis. The IUCN Red List of Threatened Species 2016: e.T13188557A13189529. Retrieved December 5, 2016, from https://doi.org/10.2305/IUCN.UK.2016-1.RLTS.T13188557A13189529.en), it is necessary to implement appropriate conservation and management strategies to ensure the long-term maintenance of genetic diversity in S. koreensis. It has been generally agreed that demographic and genetic information of endangered plant species is essential for formulating comprehensive conservation strategies (Falk & Holsinger, 1991Falk, D. A. & Holsinger, K. E. (Eds.) 1991. Genetics and conservation of rare plants. Oxford University Press, Oxford.; Hamrick & Godt, 1996Hamrick, J. L. & Godt, M. J. W. 1996. Conservation genetics of endemic plant species. In: Avise, J. C. & Hamrick, J. L. (Eds.), Conservation genetics. Chapman & Hall, New York: 281–304. https://doi.org/10.1007/978-1-4757-2504-9_9). Although several short-term ecological and demographic surveys have been conducted for S. koreensis in ROK (Cheon et al., 2009Cheon, K.-S., Jang, S.-K., Lee, W.-T. & Yoo, K.-O. 2009. 개느삼의 분포와 자생지 환경특성 [The natural habitat and distribution of Echinosophora koreensis (Nakai) Nakai in Korea]. Korean Journal of Plant Taxonomy 39: 254–263 [in Korean].; Oh et al., 2009Oh, B. U., Han, J. W., Yang, S. K., Jang, E. S., Jang, C. G., Kim, Y. Y. & Kang, S. H. 2009. 강원도 양구군 특산식물 개느삼(콩과) 자생지 내의 식물상과 식생 – 양구군 남면 죽곡리, 황강리를 중심으로 [Flora and vegetation in a habitat of Echinosophora koreensis (Nakai) Nakai (Leguminosae), a Korean endemic plant in Yanggu-gun (Kangwon), Korea–Focused on Jukgok-ri and Hwanggang-ri]. Journal of the Korea Society of Environmental Restoration Technology 12: 19–28 [in Korean].), levels of genetic diversity at regional (e.g. ROK) or species levels are currently not well understood. For the latter case, it might be nearly impossible because of practical unavailability of samples from DPRK. The only genetic study available to date, apart from the isolation and characterization of 13 microsatellite loci for the species (Lee et al., 2012Lee, J.-Y., Lee, D.-H. & Choi, B.-H. 2012. Isolation and characterization of 13 microsatellite loci from a Korean endemic species, Sophora koreensis (Fabaceae). International Journal of Molecular Sciences 13: 10765–10770. https://doi.org/10.3390/ijms130910765), is a fine-scale genetic structure (FSGS) survey using ISSR in two populations (that were nearly the same as HAN-2 and YIM-1; Fig. 1) in Yanggu County; a strong genet-based FSGS was found (most clones’ aggregation at less than 6-m interplant distance), presumably due to limited seed and pollen dispersal (Chung et al., 2006Chung, J. M., Lee, B. C., Kim, J. S., Park, C.W., Chung, M. Y. & Chung, M. G. 2006. Fine-scale structure among genetic individuals of the clone-forming monotypic genus Echinosophora koreensis (Fabaceae). Annals of Botany 98: 165–173. https://doi.org/10.1093/aob/mcl083), together with a moderate degree of genetic differentiation between the two populations (ΦST = 0.184).
In this study, we expand the previous study of Chung et al. (2006Chung, J. M., Lee, B. C., Kim, J. S., Park, C.W., Chung, M. Y. & Chung, M. G. 2006. Fine-scale structure among genetic individuals of the clone-forming monotypic genus Echinosophora koreensis (Fabaceae). Annals of Botany 98: 165–173. https://doi.org/10.1093/aob/mcl083) to investigate levels and distribution of genetic variation at the landscape level (in a range of ca. 6 km) in a part of Yanggu County (Fig. 1). With this spatial scale, we are especially interested in getting insights into the degree of genetic differentiation between adjacent populations within each locality (e.g. Williams, 1994Williams, C. F. 1994. Genetic consequences of seed dispersal in three sympatric forest herbs. II. Microspatial genetic structure within populations. Evolution 48: 1959–1972. https://doi.org/10.2307/2410520; Williams & Guries, 1994Williams, C. F. & Guries, R. P. 1994. Genetic consequences of seed dispersal in three sympatric forest herbs. I. Hierarchical population genetic structure. Evolution 48: 791–805. https://doi.org/10.2307/2410487; Chung et al., 2002Chung, M. Y., Nason, J. D., Chung, M. G., Kim, K.-J., Park, C.-W., Sun, B.-Y. & Pak, J.-H. 2002. Landscape-level spatial genetic structure in Quercus acutissima (Fagaceae). American Journal of Botany 89: 1229–1236. https://doi.org/10.3732/ajb.89.8.1229). In general, marginal populations of plant species exhibit significantly reduced within-population genetic variability and increased among-population differentiation relative to geographically central populations (reviewed in Eckert et al., 2008Eckert, C. G., Samis, K. E. & Lougheed, S. C. 2008. Genetic variation across species’ geographical ranges: the central-marginal hypothesis and beyond. Molecular Ecology 17: 1170–1188.https://doi.org/10.1111/j.1365-294X.2007.03659.x). This might be the consequence of lower gene flow and higher random genetic drift in small peripheral populations (Schnabel & Hamrick, 1990Schnabel, A. & Hamrick, J. L. 1990. Organization of genetic diversity within and among populations of Gleditsia triacanthos (Leguminosae). American Journal of Botany 77: 1060–1069. https://doi.org/10.2307/2444577; Gibson & Hamrick, 1991Gibson, J. P. & Hamrick, J. L. 1991. Genetic diversity and structure in Pinus pungens (table mountain pine) populations. Canadian Journal of Forest Research 21: 635–642. https://doi.org/10.1139/x91-087). Given the fact that populations in ROK are within the southernmost limit of the species distribution, we would expect low levels of within-population genetic variation and a moderate degree of genetic differentiation. With the genetic data obtained we are providing suggestions for in situ and ex situ conservation strategies.
|
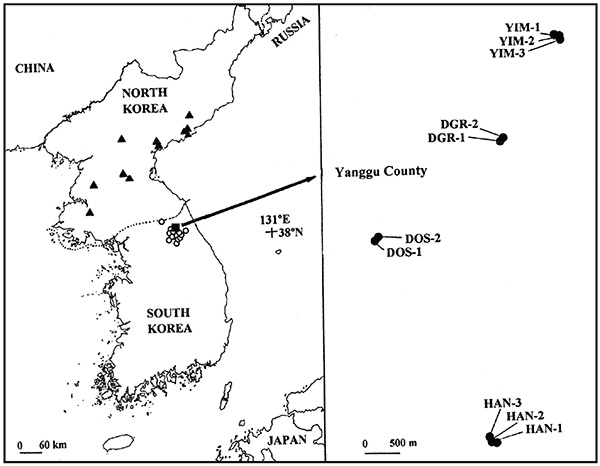
Figure 1. Current and past distribution of Sophora koreensis in Democratic People’s Republic of Korea (11 closed triangles) (Chang et al., 2016Chang, C. S., Kim, H., Son, S. & Kim, Y.-S. 2016. The Red list of selected vascular plants in Korea. Korea National Arboretum and Korean Plant Specialist Group, Pocheon.) and in Republic of Korea (12 open circles and four localities in a closed square) (Cheon et al., 2009Cheon, K.-S., Jang, S.-K., Lee, W.-T. & Yoo, K.-O. 2009. 개느삼의 분포와 자생지 환경특성 [The natural habitat and distribution of Echinosophora koreensis (Nakai) Nakai in Korea]. Korean Journal of Plant Taxonomy 39: 254–263 [in Korean].; the present study), and the 10 sampled populations (closed circles) from four localities (a “locality” is a group of adjacent populations within an administrative boundary) in Yanggu County, Kangwon Province, Republic of Korea. HAN: Hanjeon Rural village; DOS: Dosa Rural village; DGR: Deokgok Rural village; YIM: Yimdang Rural village.
[View full size] [Descargar tamaño completo] |
|
MATERIALS AND METHODSTop
Study species
Sophora koreensis is a pioneer species that can potentially invade open, sunny forest gaps (Yim, 1993Yim, K.-B. 1993. 천연기념물: 식물편 [Botanical treasures (natural monuments) of Korea]. Daewonsa, Seoul [in Korean].). The study species is rapidly spreading by the underground rhizomes in disturbed areas (e.g. burnt areas). For example, we identified a 180-cm long rhizome in HAN-2 (Fig. 1) in May 2004, about three years and half after a fire affected the whole locality. Density of individuals in HAN locality was relatively high until 2009 (Cheon et al., 2009Cheon, K.-S., Jang, S.-K., Lee, W.-T. & Yoo, K.-O. 2009. 개느삼의 분포와 자생지 환경특성 [The natural habitat and distribution of Echinosophora koreensis (Nakai) Nakai in Korea]. Korean Journal of Plant Taxonomy 39: 254–263 [in Korean].), when it started to decrease due to more shade conditions produced by the growth of broad-leaved deciduous trees such as oaks and ashes (J. M. Chung, pers. comm.). In May, 10 to 20 yellow flowers (ca. 3–5 cm long) per inflorescence bloom and are frequently visited by the bumblebee Bombus diversus diversus (Chung et al., 2006Chung, J. M., Lee, B. C., Kim, J. S., Park, C.W., Chung, M. Y. & Chung, M. G. 2006. Fine-scale structure among genetic individuals of the clone-forming monotypic genus Echinosophora koreensis (Fabaceae). Annals of Botany 98: 165–173. https://doi.org/10.1093/aob/mcl083). The species is self-compatible under greenhouse conditions (Chung et al., 2006Chung, J. M., Lee, B. C., Kim, J. S., Park, C.W., Chung, M. Y. & Chung, M. G. 2006. Fine-scale structure among genetic individuals of the clone-forming monotypic genus Echinosophora koreensis (Fabaceae). Annals of Botany 98: 165–173. https://doi.org/10.1093/aob/mcl083). Fruits (legumes, ca. 7 cm long) ripen from July to September and contain two or three seeds. The drying of the pods makes them shrink and seeds fall around the parent plant (“shattering”; Quick et al., 2017Quick, Z. I., Houseman, G. R. & Büyüktahtakin, I. E. 2017. Assessing wind and mammals as seed dispersal vectors in an invasive legume. Weed Research 57: 35–43. https://doi.org/10.1111/wre.12232). There are apparently no specialized mechanisms of seed dispersal.
Population sampling
To determine levels of allozyme diversity in S. koreensis, in May 2004 we collected one leaf from 397 shoots belonging to 10 populations, that are distributed among four different localities (Fig. 1 and Table 1): three populations in HAN (ca. 80 × 100 m area) and YIM (ca. 80 × 150 m area) localities, and two populations in Dosa Rural village (DOS; 40 × 50 m area; Fig. 1) and in Deokgoek Rural village (DGR; 50 × 60 m area). Sample sizes ranged from 78 in HAN-2 to 12 in DGR-2 (Table 1). To prevent sampling of clonal ramets, we collected shoots at ca. 4 m intervals across each population. All sampled leaf material was kept on ice until it could be transported to the laboratory, where it was stored at 4°C until protein extraction.
| Table 1. Levels of genetic diversity and fixation index in 10 populations of Sophora koreensis1. |
|
Species/population
|
N
|
Area (m)
|
NP
|
%P
|
AR
|
A
|
Ho (SE)
|
He (SE)
|
F
|
|
Sophora koreensis
|
|
|
|
|
|
|
|
|
|
|
HAN-1
|
68
|
30 × 80
|
|
28.6
|
1.16
|
1.29
|
0.023 (0.019)
|
0.040 (0.031)
|
0.421
|
|
HAN-2
|
78
|
40 × 50
|
|
28.6
|
1.22
|
1.29
|
0.014 (0.006)
|
0.055 (0.036)
|
0.748
|
|
HAN-3
|
61
|
40 × 70
|
|
14.3
|
1.12
|
1.14
|
0.012 (0.009)
|
0.018 (0.012)
|
0.338
|
|
DOS-1
|
28
|
20 × 40
|
|
0.0
|
1.00
|
1.00
|
0.000 (0.000)
|
0.000 (0.000)
|
na
|
|
DOS-2
|
21
|
20 × 50
|
|
0.0
|
1.00
|
1.00
|
0.000 (0.000)
|
0.000 (0.000)
|
na
|
|
DGR-1
|
30
|
30 × 50
|
|
7.1
|
1.07
|
1.07
|
0.012 (0.012)
|
0.011 (0.011)
|
−0.070
|
|
DGR-2
|
12
|
30 × 40
|
|
7.1
|
1.07
|
1.07
|
0.024 (0.024)
|
0.038 (0.038)
|
0.371
|
|
YIM-1
|
31
|
40 × 50
|
|
21.4
|
1.21
|
1.21
|
0.055 (0.034)
|
0.072 (0.040)
|
0.227
|
|
YIM-2
|
24
|
40 × 60
|
|
21.4
|
1.11
|
1.21
|
0.009 (0.005)
|
0.009 (0.005)
|
0.000
|
|
YIM-3
|
44
|
50 × 60
|
|
7.1
|
1.07
|
1.07
|
0.010 (0.010)
|
0.015 (0.015)
|
0.333
|
|
Average
|
39.7
|
|
|
13.6
|
1.10
|
1.14
|
0.016 (0.012)
|
0.026 (0.006)
|
0.5562
|
|
Pooled samples
|
397
|
|
12
|
35.7
|
|
1.36
|
0.016 (0.004)
|
0.037 (0.023)
|
|
|
S. fernandeziana3
|
|
|
|
|
|
|
|
|
|
|
Population mean
|
|
|
5
|
19.0
|
|
|
|
0.022
|
|
|
Pooled samples
|
|
|
|
|
|
|
|
0.038
|
|
|
S. moorcroftiana4
|
|
|
|
|
|
|
|
|
|
|
Population mean
|
ca. 40
|
|
|
27.5
|
|
1.50
|
0.100 (0.006)
|
0.122 (0.007)
|
0.1462
|
|
Pooled samples
|
398
|
|
10
|
33.3
|
|
1.90
|
0.101 (0.034)
|
0.150 (0.047)
|
|
|
1 Abbreviations: N: sample size; NP: number of populations surveyed; %P: percentage of polymorphic loci; AR: mean allelic richness (adjusted for a sample size of 12); A: mean number of alleles per locus; Ho: observed heterozygosity; He: H–W expected heterozygosity or Nei’s gene diversity; SE: standard error; F: fixation index; P: level of significance (or P-value); na: not applicable.
2 Grand mean (FIS) following Weir & Cockerham (1984Weir, B. S. & Cockerham, C. C. 1984. Estimating F-statistics for the analysis of population structure. Evolution 38: 1358–1370. https://doi.org/10.2307/2408641).
3, 4 data from Liu et al. (2006Liu, Z.-M., Zhao, A.-M., Kang, X.-Y., Zhou, S.-L. & López-Pujol, J. 2006. Genetic diversity, population structure, and conservation of Sophora moorcroftiana (Fabaceae), a shrub endemic to the Tibetan Plateau. Plant Biology 8: 81–92. https://doi.org/10.1055/s-2005-872889) and Crawford et al. (2001Crawford, D. J., Ruiz, E., Stuessy, T. F. et al. 2001. Allozyme diversity in endemic flowering plant species of the Juan Fernandez Archipelago, Chile: ecological and historical factors with implications for conservation. American Journal of Botany 88: 2195–2203. https://doi.org/10.2307/3558381), respectively.
|
Enzyme electrophoresis
Using a phosphate-polyvinylpyrrolidone buffer (Mitton et al., 1979Mitton, J. B., Linhart, Y. B., Sturgeon, K. B. & Hamrick, J. L. 1979. Allozyme polymorphisms detected in mature needle tissue of ponderosa pine. Journal of Heredity 70: 86–89.), we extracted enzymes and conducted horizontal starch-gel electrophoresis using 13% gels. We resolved 14 putative loci from eight enzyme systems using two buffer systems (Table 2). Stain recipes were taken from Soltis et al. (1983Soltis, D. E., Haufler, C. H., Darrow, D. C. & Gastony, G. J. 1983. Starch gel electrophoresis of ferns: a compilation of grinding buffers, gel and electrode buffers, and staining schedules. American Fern Journal 73: 9–27. https://doi.org/10.2307/1546611), except for diaphorase (Cheliak & Pitel, 1984Cheliak, W. M. & Pitel, J. P. 1984. Technique for starch gel electrophoresis of enzyme from forest tree species. Information report PI-X-42. Petawawa National Forestry Institute, Chalk River.). We designated putative loci sequentially, with the most anodally migrating isozyme designated as 1, the next 2, and so on. We also designated different alleles per locus sequentially by alphabetical order (a, b).
| Table 2. The allozyme loci assayed for Sophora koreensis and the buffer systems used to resolve them1. |
|
Buffer system
|
Enzyme and loci resolved (E.C. code)
|
|
6
|
Diaphorase (Dia) (E.C. 1.6.99.-)
|
|
Fluorescent esterase (Fe-1, Fe-2, Fe-3) (E.C. 3.1.1.-)
|
|
Phosphoglucoisomerase (Pgi) (E.C. 5.3.1.9)
|
|
Phosphoglucomutase (Pgm-1, Pgm-2) (E.C. 5.4.2.2)
|
|
Triosephosphate isomerase (Tpi) (E.C. 5.3.1.1)
|
|
|
|
MC
|
Isocitrate dehydrogenase (Idh-1, Idh-2) (E.C. 1.1.1.42)
|
|
Malate dehydrogenase (Mdh-1, Mdh-2) (E.C. 1.1.1.37)
|
|
6-Phosphogluconate dehydrogenase (6Pgd-1, 6Pgd-2) (E.C. 1.1.1.44)
|
|
| 1 Buffer systems 6 and MC (morpholine-citrate system, pH 6.1) were from Soltis et al. (1983Soltis, D. E., Haufler, C. H., Darrow, D. C. & Gastony, G. J. 1983. Starch gel electrophoresis of ferns: a compilation of grinding buffers, gel and electrode buffers, and staining schedules. American Fern Journal 73: 9–27. https://doi.org/10.2307/1546611) and Clayton & Tretiak (1972Clayton, J. W. & Tretiak, D. N. 1972. Amine citrate buffers for pH control in starch gel electrophoresis. Journal of the Fisheries Research Board of Canada 29: 1169–1172. https://doi.org/10.1139/f72-172), respectively. |
Data analyses
To estimate genetic diversity and genetic structure, a locus was considered polymorphic if two or more alleles were observed, regardless of their frequencies. The following genetic diversity parameters were estimated using the programs POPGENE (Yeh et al., 1999Yeh, F. C., Yang, R. C. & Boyle, T. B. J. 1999. POPGENE. Version 1.31. Microsoft Windows-based free ware for population genetic analysis. Department of Renewable Resources, University of Alberta, Edmonton. Retrieved March 12, 2011, from http://www.ualberta.ca/~fyeh/index/htm ) and FSTAT (Goudet, 2002Goudet, J. 2002. FSTAT, a program to estimate and test gene diversities and fixation indices (version 2.9.3.2). Department of Ecology & Evolution, University de Lausanne, Lausanne. Retrieved May 13, 2011, from: http://www.unil.ch/izea/softwares/fstat.html): percent polymorphic loci (%P), mean number of alleles per locus (A), allelic richness (AR; El Mousadik & Petit, 1996El Mousadik, A. & Petit, R. J. 1996 . High level of genetic differentiation for allelic richness among populations of the argan tree [Argania spinosa (L.) Skeels] endemic to Morocco. Theoretical and Applied Genetics 92 : 832–839. https://doi.org/10.1007/BF00221895) corrected by minimum sample size (N = 12 in DGR-2; Table 1); observed heterozygosity (Ho), and Nei’s (1978Nei, M. 1978. Estimation of average heterozygosity and genetic distance from a small number of individuals. Genetics 89: 583–590.) unbiased gene diversity (He).
We calculated mean fixation indices (F) across polymorphic loci for each population, and their levels of significance (or P values) by gene permutation tests (999 replicates) assuming the null hypothesis (F = 0) is true using the program SPAGeDi (Hardy & Vekemans, 2002Hardy, O. J. & Vekemans, X. 2002. SPAGeDi: a versatile computer program to analyze spatial genetic structure at the individual or population level. Molecular Ecology Notes 2: 618–620. https://doi.org/10.1046/j.1471-8286.2002.00305.x). We estimated Wright’s (1965Wright, S. 1965. The interpretation of population structure by F-statistics with special regard to systems of mating. Evolution 19: 395–420. https://doi.org/10.2307/2406450) FIS and FST following the method of Weir & Cockerham (1984Weir, B. S. & Cockerham, C. C. 1984. Estimating F-statistics for the analysis of population structure. Evolution 38: 1358–1370. https://doi.org/10.2307/2408641) to measure the average level (grand mean) of inbreeding within populations and genetic differentiation among them, with the aid of FSTAT. We estimated the 95% confidence intervals (CI) by bootstrapping over loci (999 replicates) around mean of the F-statistics, and considered the observed F-statistics to be significant when 95% CI did not overlap zero. We tested differences between the two population groups (HAN and YIM) for observed statistics, OSx (AR, Ho, He, FIS, and FST). We chose these two localities because they are national monuments; thus, any differences in genetic parameters might be informative for conservation plans. To do this, we used a permutation scheme (999 replicates) by randomly allocating whole samples to the different groups, keeping the number of samples in each group constant and calculating differences between the two groups for randomized statistics, RSx. We then obtained the P value of the test as the proportion of randomized data sets giving a larger RSx than OSx. These calculations were also performed using FSTAT (Goudet, 2002Goudet, J. 2002. FSTAT, a program to estimate and test gene diversities and fixation indices (version 2.9.3.2). Department of Ecology & Evolution, University de Lausanne, Lausanne. Retrieved May 13, 2011, from: http://www.unil.ch/izea/softwares/fstat.html).
We conducted an analysis of molecular variance (AMOVA) using the program GenAlEx v6.5 (Peakall & Smouse, 2006Peakall, R. & Smouse, P. E. 2006. GenAlEx 6: genetic analysis in Excel. Population genetic software for teaching and research. Molecular Ecology Notes 6: 288–295. https://doi.org/10.1111/j.1471-8286.2005.01155.x) to test for the influence of individuals within populations, populations within localities, and localities on the observed genetic variation. In addition, we constructed an UPGMA (unweighted pair-group method using arithmetic averages) phenogram from Nei et al.’s (1983Nei, M., Tajima, F. & Tateno, Y. 1983. Accuracy of estimated phylogenetic trees from molecular data. II. Gene frequency data. Journal of Molecular Evolution 19:153–170. https://doi.org/10.1007/bf02300753) genetic distance matrix with branch support produced by 1000 bootstrapping over loci, utilizing Populations v1.2.30 (Langella, 1999Langella, O. 1999. Populations version 1.2.30. Retrieved August 14, 2013, from http://bioinformatics.org/~tryphon/populations/) and TreeView v1.6 (Page, 1996Page, R. D. M. 1996. TreeView: an application to display phylogenetic trees on personal computers. Computer Applications in the Bioscience 12: 357–358.). We conducted a linear regression analysis between all pairwise FST/(1 – FST) (FST was calculated following Weir & Cockerham, 1984Weir, B. S. & Cockerham, C. C. 1984. Estimating F-statistics for the analysis of population structure. Evolution 38: 1358–1370. https://doi.org/10.2307/2408641) and the corresponding logarithm (ln) of pairwise geographical distances (Rousset, 1997Rousset, F. 1997. Genetic differentiation within and between two habitats. Genetics 151: 397–407.) to find the overall pattern of genetic structure at the regional scale (i.e. isolation-by-distance effects). Using FSTAT, we tested a linear regression model using a Mantel test (by making 999 replicates) under the null hypothesis of no spatial genetic structure (regression slope, b = 0).
RESULTSTop
Genetic diversity and fixation index
Of the 14 putative loci surveyed, only five (Dia, Fe-1, Fe-2, 6Pgd-1, and Tpi; Table 3) were polymorphic, resulting in low levels of allozyme variation (Table 1). At the population level, the mean percentage of polymorphic loci (%P) was 13.6, the mean number of alleles per locus (A) was 1.14, and the mean genetic diversity (He) was 0.026 (Table 1). Higher levels were found when the samples were pooled (N = 397, %P = 35.7, A = 1.36, and He = 0.037; Table 1). YIM-1 exhibited the highest He estimate, whereas no variation was found in DOS-1 and DOS-2 (Table 1).
Average F values in four populations (HAN-1, HAN-2, HAN-3, and YIM-3; Table 1) indicated a significant deficiency of heterozygotes, with a grand mean of FIS = 0.556 (Table 1; 95% CI was from 0.016 to 0.297). Permutation test (999 replicates) revealed no significant differences for AR (P = 0.617), Ho (P = 0.568), He (P = 0.734), and FIS (P = 0.340) between HAN and YIM.
| Table 3. Allele frequencies at five polymorphic loci in 10 populations of Sophora koreensis. |
|
Locus
|
Allele
|
Population
|
|
|
|
HAN-1
|
HAN-2
|
HAN-3
|
DOS-1
|
DOS-2
|
DGR-1
|
DGR-2
|
YIM-1
|
YIM-2
|
YIM-3
|
|
Fe-1
|
a
|
1.000
|
0.962
|
1.000
|
1.000
|
1.000
|
1.000
|
1.000
|
0.694
|
0.979
|
1.000
|
|
b
|
0.000
|
0.038
|
0.000
|
0.000
|
0.000
|
0.000
|
0.000
|
0.306
|
0.021
|
0.000
|
|
Fe-2
|
a
|
0.985
|
0.936
|
1.000
|
1.000
|
1.000
|
1.000
|
1.000
|
1.000
|
1.000
|
1.000
|
|
b
|
0.015
|
0.064
|
0.000
|
0.000
|
0.000
|
0.000
|
0.000
|
0.000
|
0.000
|
0.000
|
|
Tpi
|
a
|
0.971
|
0.968
|
0.943
|
1.000
|
1.000
|
1.000
|
1.000
|
0.871
|
0.979
|
1.000
|
|
b
|
0.029
|
0.032
|
0.057
|
0.000
|
0.000
|
0.000
|
0.000
|
0.129
|
0.021
|
0.000
|
|
Dia
|
a
|
0.676
|
0.487
|
0.926
|
1.000
|
1.000
|
0.917
|
0.500
|
1.000
|
0.979
|
0.886
|
|
b
|
0.324
|
0.513
|
0.074
|
0.000
|
0.000
|
0.083
|
0.500
|
0.000
|
0.021
|
0.114
|
|
6Pgd-1
|
a
|
0.015
|
0.000
|
0.000
|
0.000
|
0.000
|
0.000
|
0.000
|
0.210
|
0.000
|
0.000
|
|
b
|
0.985
|
1.000
|
1.000
|
1.000
|
1.000
|
1.000
|
1.000
|
0.790
|
1.000
|
1.000
|
|
Genetic differentiation among populations
Significant differentiation among populations was found in S. koreensis at the landscape level (mean FST = 0.203, 95% CI was from 0.032 to 0.245). Permutation test indicated no significant difference for FST (P = 0.813) between HAN and YIM. We unexpectedly found high (FST among three populations in HAN = 0.583; FST between two populations in DGR = 0.389) or moderate (FST among three populations in YIM = 0.233) degree of genetic differentiation among populations within the three localities (no allozyme variation in DOS). Consistent with this, the AMOVA analyses revealed a considerable genetic differentiation among populations within localities (17%; Table 4). This estimate was considerably higher than that of variation among the four localities (5%; Table 4).
| Table 4. Results of the analysis of molecular variance (AMOVA) for Sophora koreensis1. |
|
Source
|
df
|
SS
|
MS
|
Variance component
|
Percent variation
|
|
Among four localities
|
3
|
16.375
|
5.458
|
0.012
|
5
|
|
Among populations within localities
|
6
|
23.607
|
3.934
|
0.046
|
17
|
|
Within populations
|
784
|
164.269
|
0.210
|
0.210
|
78
|
|
Total
|
793
|
204.251
|
|
0.268
|
100
|
|
1 Abbreviations: df, degrees of freedom; SS, sum of squares; MS, mean squares; percent variation, percentage of total variance contributed by each component. |
Despite the non-statistical support of the UPGMA phenogram, it provides a general idea about the clustering of the studied populations (Fig. 2). Most groupings showed little relationship with populations’ geographic location; a notable exception were the populations DOS-1 and DOS-2, that were placed together because of the same banding patterns (no variation). The correlation between pairwise genetic differentiation estimates and their corresponding natural ln of pairwise geographic distances was very low (r = 0.032, P = 0.842) and indicated that ca. 100% of the variation in genetic differentiation was due to unknown factors other than distance (Fig. 3).
DISCUSSIONTop
Low levels of within-population variation and inbreeding
As expected, populations of S. koreensis exhibited low levels of genetic variation (%P = 13.6, A = 1.14, He = 0.026). These estimates were clearly lower than the reference values for both endemic species and narrowly-distributed ones (%P = 26.3, A = 1.39, He = 0.063, N = 100; %P = 30.6, A = 1.45, He = 0.105, N = 115; Hamrick & Godt, 1989Hamrick , J. L. & Godt, M. J. W. 1989. Allozyme diversity in plant species. In: Brown, A. H. D., Clegg, M. T., Kahler, A. L. & Weir, B. S. (Eds.), Plant population genetics, breeding and genetic resources. Sinauer, Sunderland: 43–63.). The population-level estimates, however, are similar to those found in its congener S. fernandeziana (Phil.) Skottsb. (%P = 19 and He = 0.022; Crawford et al., 2001Crawford, D. J., Ruiz, E., Stuessy, T. F. et al. 2001. Allozyme diversity in endemic flowering plant species of the Juan Fernandez Archipelago, Chile: ecological and historical factors with implications for conservation. American Journal of Botany 88: 2195–2203. https://doi.org/10.2307/3558381). Sophora fernandeziana is a hummingbird-pollinated species endemic to Robinson Crusoe Island (ca. 48 km2, known also as Más a Tierra or Más Atierra until 1966), a part of the Juan Fernández Archipelago, located 667 km west of South America (Chile) at 33° S latitude, in the South Pacific Ocean. Crawford et al. (2001Crawford, D. J., Ruiz, E., Stuessy, T. F. et al. 2001. Allozyme diversity in endemic flowering plant species of the Juan Fernandez Archipelago, Chile: ecological and historical factors with implications for conservation. American Journal of Botany 88: 2195–2203. https://doi.org/10.2307/3558381) attributed the low levels of allozyme diversity to random genetic drift operating in the small, scattered populations. Another studied congener is the insect-pollinated S. moorcroftiana (Benth.) Benth. ex Baker from the Qinghai-Tibetan Plateau (QTP) in western China. Liu et al. (2006Liu, Z.-M., Zhao, A.-M., Kang, X.-Y., Zhou, S.-L. & López-Pujol, J. 2006. Genetic diversity, population structure, and conservation of Sophora moorcroftiana (Fabaceae), a shrub endemic to the Tibetan Plateau. Plant Biology 8: 81–92. https://doi.org/10.1055/s-2005-872889) examined allozyme diversity from 10 populations in the middle reaches (in a range of ~630 km) of the Yarlung Zangbo (Brahmaputra) River. As one may expect for a species with a wider geographic distribution, moderate levels of within-population genetic variation were found in S. moorcroftiana (%P = 27.5, A = 1.50, He = 0.122; Liu et al., 2006Liu, Z.-M., Zhao, A.-M., Kang, X.-Y., Zhou, S.-L. & López-Pujol, J. 2006. Genetic diversity, population structure, and conservation of Sophora moorcroftiana (Fabaceae), a shrub endemic to the Tibetan Plateau. Plant Biology 8: 81–92. https://doi.org/10.1055/s-2005-872889).
These three Sophora species would have followed their unique evolutionary trajectories. Past histories (e.g. uplift of the QTP for S. moorcroftiana and island colonization for S. fernandeziana) might have greatly contributed to levels of genetic diversity and genetic structure. The broad-leaved deciduous shrub S. koreensis is one of the elements of the mixed (boreal-temperate) forest on the Korean Peninsula. At the Last Glacial Maximum (LGM, 21,000 years before present, BP) S. koreensis might have occurred within a narrow mixed forest zone in the southern and western parts of the Peninsula (further south compared to its present distribution; see Fig. 2A in Chung et al., 2017Chung, M. Y., López-Pujol, J. & Chung, M. G. 2017. The role of the Baekdudaegan (Korean Peninsula) as a major glacial refugium for plant species: A priority for conservation. Biological Conservation [published ahead of print]. https://doi.org/10.1016/j.biocon.2016.11.040). The onset of the Holocene (ca. 12,000 years BP) and the accompanying climatic amelioration would had led to a post-glacial recolonization process for the mixed forests towards the north (i.e. to central and northern Korea) from putative refugial population(s) in southern Korea. Under this scenario, levels of genetic diversity in the current populations of S. koreensis in central and northern Korea would be low due to multiple founder effects (e.g. Kim et al., 2005Kim, Z. S., Hwang, J. W., Lee, S. W., Yang, C. & Gorovoy, P. G. 2005. Genetic variation of Korean pine (Pinus koraiensis Sieb. et Zucc.) at allozyme and RAPD markers in Korea, China and Russia. Silvae Genetica 54: 235–246.; reviewed in Chung et al., 2017Chung, M. Y., López-Pujol, J. & Chung, M. G. 2017. The role of the Baekdudaegan (Korean Peninsula) as a major glacial refugium for plant species: A priority for conservation. Biological Conservation [published ahead of print]. https://doi.org/10.1016/j.biocon.2016.11.040). Kim et al. (2015Kim, I. R., Yu, D. & Choi, H.-K. 2015. AFLP 마커를 이용한 조릿대 개체군의 식물지리학적 연구 [A phytogeographical study of Sasa borealis populations based on AFLP analysis]. Korean Journal of Plant Taxonomy 45: 29–35 [in Korean]. https://doi.org/10.11110/kjpt.2015.45.1.29) revealed that within-population genetic diversity (He) of the draft bamboo Sasa borealis (Hack.) Makino & Shibata populations in South Korea was inversely proportional to the latitude (r = 0.719, P = 0.009). If this scenario is true for S. koreensis, we will expect that levels of within-population genetic diversity would decrease with increasing latitudes. However, a test of this hypothesis seems to be impossible because of political problems (at present it is not feasible to sample in DPRK by scientists from ROK).
The significant deficit of heterozygotes seen in the four populations (HAN-1, HAN-2, HAN-3, and YIM-3) can be attributed to the occurrence of selfing and/or biparental inbreeding, likely resulting from limited pollen and/or seed dispersal (Chung et al., 2006Chung, J. M., Lee, B. C., Kim, J. S., Park, C.W., Chung, M. Y. & Chung, M. G. 2006. Fine-scale structure among genetic individuals of the clone-forming monotypic genus Echinosophora koreensis (Fabaceae). Annals of Botany 98: 165–173. https://doi.org/10.1093/aob/mcl083). Even though we tried to prevent duplicate samples, unintentional inclusion of some samples would lead to over- or underestimation of fixation indices. In addition, as individuals in some populations are patchily distributed (J. M. Chung, pers. comm.), a Wahlund effect might be involved in some of the apparent inbreeding observed. Detailed field studies are needed to evaluate the relative contribution of selfing vs. biparental inbreeding to total inbreeding.
Genetic differentiation among populations
Given the ~6 km study range, the FST value (0.203) is notably high. A similar result was found in ISSR-based genetic differentiation between HAN-2 and YIM-1 (ΦST = 0.184; Chung et al., 2006Chung, J. M., Lee, B. C., Kim, J. S., Park, C.W., Chung, M. Y. & Chung, M. G. 2006. Fine-scale structure among genetic individuals of the clone-forming monotypic genus Echinosophora koreensis (Fabaceae). Annals of Botany 98: 165–173. https://doi.org/10.1093/aob/mcl083). These estimates are only slightly lower than those reported for endemic species [Nei’s (1973Nei, M. 1973. Analysis of gene diversity in subdivided populations. Proceedings of the National Academy of Sciences of the United States of America 70: 3321–3323. https://doi.org/10.1073/pnas.70.12.3321) GST = 0.248] and narrowly-distributed species (GST = 0.242; Hamrick & Godt, 1989Hamrick , J. L. & Godt, M. J. W. 1989. Allozyme diversity in plant species. In: Brown, A. H. D., Clegg, M. T., Kahler, A. L. & Weir, B. S. (Eds.), Plant population genetics, breeding and genetic resources. Sinauer, Sunderland: 43–63.). Our estimate of genetic differentiation for S. koreensis is even higher than that S. moorcroftiana populations (FST = 0.199; Liu et al., 2006Liu, Z.-M., Zhao, A.-M., Kang, X.-Y., Zhou, S.-L. & López-Pujol, J. 2006. Genetic diversity, population structure, and conservation of Sophora moorcroftiana (Fabaceae), a shrub endemic to the Tibetan Plateau. Plant Biology 8: 81–92. https://doi.org/10.1055/s-2005-872889), which is quite unexpected given the substantially larger sampling area of S. moorcroftiana (the distances between each locality range from 30 to 630 km; Liu et al., 2006Liu, Z.-M., Zhao, A.-M., Kang, X.-Y., Zhou, S.-L. & López-Pujol, J. 2006. Genetic diversity, population structure, and conservation of Sophora moorcroftiana (Fabaceae), a shrub endemic to the Tibetan Plateau. Plant Biology 8: 81–92. https://doi.org/10.1055/s-2005-872889). The authors attributed the moderate degree of genetic differentiation among 10 populations to the secondary seed movement by water streams (hydrochoric gene flow; note that the species occurs along relatively open river valleys). Furthermore, their findings of a significant correlation between genetic and geographic distance (r = 0.707, P = 0.002) suggest a balance between random genetic drift and gene flow. As insect movement would be limited, secondary seed dispersal via river water current might be possible. In contrast to these studies, Crawford et al. (2001Crawford, D. J., Ruiz, E., Stuessy, T. F. et al. 2001. Allozyme diversity in endemic flowering plant species of the Juan Fernandez Archipelago, Chile: ecological and historical factors with implications for conservation. American Journal of Botany 88: 2195–2203. https://doi.org/10.2307/3558381) found high degree of genetic differentiation among five S. fernandeziana populations on Robinson Crusoe Island (ca. 48 km2) (GST = 0.351). The authors suggested that high genetic differentiation is due to the fact that its populations are small and have a scattered distribution along the island. Thus, random genetic drift would have operated in these small populations in the remote oceanic island.
Samples from the three populations (YIM-1, YIM-2, and YIM-3) in YIM were collected in an area of ca. 80 × 150 m and those from three populations (HAN-1, HAN-2, and HAN-3) in HAN were from an area of ca. 80 × 100 m. Even though the three populations are very closely located each other both in YIM and HAN, we found significant differences in allelic frequencies. For example, the allele 6Pgd-1a was present in HAN-1 and YIM-1 with frequencies of 0.015 and 0.210, but it did not occur in the remaining populations (Table 3). Unexpectedly, this allele was not present in YIM-2 and YIM-3. Similarly, the allele Fe-1b was present in HAN-2, YIM-1, and YIM-2 with frequencies of 0.038, 0.306, and 0.021, respectively, but not in the remaining populations of both HAN and YIM localities. These findings strongly suggest limited gene dispersal within approximately 1 ha area, which is supported by the strong FSGS detected in HAN-2 and YIM-1 (Sp, a statistic that represents the strength of FSGS, was 0.072 in HAN-2 and 0.093 in YIM-1; Chung et al., 2006Chung, J. M., Lee, B. C., Kim, J. S., Park, C.W., Chung, M. Y. & Chung, M. G. 2006. Fine-scale structure among genetic individuals of the clone-forming monotypic genus Echinosophora koreensis (Fabaceae). Annals of Botany 98: 165–173. https://doi.org/10.1093/aob/mcl083). Consistent with these results, we found little association between genetic and geographic distances (Figs. 2 and 3) and a considerable genetic differentiation among populations within localities (Table 4).
Implications for conservation
Before discussing on genetic aspects, and based on available ecological information, our own field observations, and personal communications, we provide two recommendations for in situ conservation in the study area. First, we suggest performing a selective removal of trees in the natural populations, as S. koreensis prefers sunny places, open forest gaps, or disturbed areas (e.g. burnt areas); when relatively fast-growing shrubs or trees (such as oaks and ashes) invade the populations producing shady conditions, many shoots are likely to disappear (J. M. Chung, pers. comm.). Indeed, removal of trees and have been conducted in the areas of Natural Monuments No. 372 (HAN and YIM) with some success (J. M. Chung, per. comm.). However, special care should be needed because the human-assisted clearance may also allow other native trees that can grow in a similar environment to thrive. Second, for in situ protection it would be necessary to take preventive measures against damage caused by the human-mediated pressure. To do this, it seems to be preferable to install a wooden fence at the boundary of the natural populations in HAN and YIM.
The population genetic structure of S. koreensis is summarized as: (1) low levels of genetic variation within populations, (2) moderate degree of differentiation among populations and considerable genetic variation among populations within localities, (3) little association between genetic and geographic distance, (4) lower genetic variation in smaller populations (e.g. DOS), and (5) a strong FSGS in populations in HAN-2 and YIM-1 (Chung et al., 2006Chung, J. M., Lee, B. C., Kim, J. S., Park, C.W., Chung, M. Y. & Chung, M. G. 2006. Fine-scale structure among genetic individuals of the clone-forming monotypic genus Echinosophora koreensis (Fabaceae). Annals of Botany 98: 165–173. https://doi.org/10.1093/aob/mcl083). In addition, as S. koreensis also reproduces vegetatively, effective population sizes will be especially small in highly clonally-formed populations. Thus, random genetic drift should have a more pronounced effect in those populations over generations (e.g. Chung et al., 2004Chung, M. Y., Nason, J. D. & Chung, M. G. 2004. Implications of clonal structure for effective population size and genetic drift in a rare terrestrial orchid, Cremastra appendiculata (Orchidaceae). Conservation Biology 18: 1515–1524. https://doi.org/10.1111/j.1523-1739.2004.00291.x). Given our genetic results, we recommend that all extant populations in ROK should be conserved in situ. Preserving entire localities (i.e. packs of close populations) instead of single populations seems a reasonable policy, given the fact that populations within each locality are separated by a few meters (localities range from 0.2 to 1.2 ha); preserving together packs of close populations also allows to maintain gene flow between populations. To ensure long-term ex situ genetic variability of S. koreensis, and based on the results of the FSGS study of Chung et al. (2006Chung, J. M., Lee, B. C., Kim, J. S., Park, C.W., Chung, M. Y. & Chung, M. G. 2006. Fine-scale structure among genetic individuals of the clone-forming monotypic genus Echinosophora koreensis (Fabaceae). Annals of Botany 98: 165–173. https://doi.org/10.1093/aob/mcl083), we suggest to collect seeds from shoots positioned at distances of ca. 10–12 m across entire localities. It is also highly advisable to carry out a genetic study across all known 16 populations in ROK with the microsatellite loci developed by Lee et al. (2012Lee, J.-Y., Lee, D.-H. & Choi, B.-H. 2012. Isolation and characterization of 13 microsatellite loci from a Korean endemic species, Sophora koreensis (Fabaceae). International Journal of Molecular Sciences 13: 10765–10770. https://doi.org/10.3390/ijms130910765), that have been proven to be highly polymorphic. In parallel to this genetic survey, long-term ecological studies (e.g. minimum viable population size and demographic dynamics, seed dispersal, pollination biology, seed germination ecology) are also necessary to reach a comprehensive management of S. koreensis.
ACKNOWLEDGMENTSTop
The authors thank M. S. Park for laboratory assistance. This research was supported by the Basic Science Research Program through the National Research Foundation of Korea (NRF) funded by the Ministry of Education (NRF-2013R1A1A2063524 and NRF-2013R1A1A3010892 to M. G. Chung and M. Y. Chung, respectively).
REFERENCESTop
|
| 1. |
Chang, C. S., Kim, H., Son, S. & Kim, Y.-S. 2016. The Red list of selected vascular plants in Korea. Korea National Arboretum and Korean Plant Specialist Group, Pocheon. |
| 2. |
Chang, C. S., Lee, H. S., Park, T. Y. & Kim, H. 2005. IUCN 적색목록 기준에 의한 환경부 멸종위기 야생식물종에 대한 평가 [Reconsideration of rare and endangered plant species in Korea based on the IUCN red list categories]. Korean Journal of Ecology 28: 305–320 [in Korean]. https://doi.org/10.5141/JEFB.2005.28.5.305 |
| 3. |
Cheliak, W. M. & Pitel, J. P. 1984. Technique for starch gel electrophoresis of enzyme from forest tree species. Information report PI-X-42. Petawawa National Forestry Institute, Chalk River. |
| 4. |
Cheon, K.-S., Jang, S.-K., Lee, W.-T. & Yoo, K.-O. 2009. 개느삼의 분포와 자생지 환경특성 [The natural habitat and distribution of Echinosophora koreensis (Nakai) Nakai in Korea]. Korean Journal of Plant Taxonomy 39: 254–263 [in Korean]. |
| 5. |
Chung, J. M., Lee, B. C., Kim, J. S., Park, C.W., Chung, M. Y. & Chung, M. G. 2006. Fine-scale structure among genetic individuals of the clone-forming monotypic genus Echinosophora koreensis (Fabaceae). Annals of Botany 98: 165–173. https://doi.org/10.1093/aob/mcl083 |
| 6. |
Chung, M. Y., López-Pujol, J. & Chung, M. G. 2017. The role of the Baekdudaegan (Korean Peninsula) as a major glacial refugium for plant species: A priority for conservation. Biological Conservation, 206: 236–248. https://doi.org/10.1016/j.biocon.2016.11.040 |
| 7. |
Chung, M. Y., Nason, J. D. & Chung, M. G. 2004. Implications of clonal structure for effective population size and genetic drift in a rare terrestrial orchid, Cremastra appendiculata (Orchidaceae). Conservation Biology 18: 1515–1524. https://doi.org/10.1111/j.1523-1739.2004.00291.x |
| 8. |
Chung, M. Y., Nason, J. D., Chung, M. G., Kim, K.-J., Park, C.-W., Sun, B.-Y. & Pak, J.-H. 2002. Landscape-level spatial genetic structure in Quercus acutissima (Fagaceae). American Journal of Botany 89: 1229–1236. https://doi.org/10.3732/ajb.89.8.1229 |
| 9. |
Clayton, J. W. & Tretiak, D. N. 1972. Amine citrate buffers for pH control in starch gel electrophoresis. Journal of the Fisheries Research Board of Canada 29: 1169–1172. https://doi.org/10.1139/f72-172 |
| 10. |
Crawford, D. J., Ruiz, E., Stuessy, T. F. et al. 2001. Allozyme diversity in endemic flowering plant species of the Juan Fernandez Archipelago, Chile: ecological and historical factors with implications for conservation. American Journal of Botany 88: 2195–2203. https://doi.org/10.2307/3558381 |
| 11. |
Eckert, C. G., Samis, K. E. & Lougheed, S. C. 2008. Genetic variation across species’ geographical ranges: the central-marginal hypothesis and beyond. Molecular Ecology 17: 1170–1188. https://doi.org/10.1111/j.1365-294X.2007.03659.x |
| 12. |
El Mousadik, A. & Petit, R. J. 1996 . High level of genetic differentiation for allelic richness among populations of the argan tree [Argania spinosa (L.) Skeels] endemic to Morocco. Theoretical and Applied Genetics 92 : 832–839. https://doi.org/10.1007/BF00221895 |
| 13. |
Falk, D. A. & Holsinger, K. E. (Eds.) 1991. Genetics and conservation of rare plants. Oxford University Press, Oxford. |
| 14. |
Gibson, J. P. & Hamrick, J. L. 1991. Genetic diversity and structure in Pinus pungens (table mountain pine) populations. Canadian Journal of Forest Research 21: 635–642. https://doi.org/10.1139/x91-087 |
| 15. |
Goudet, J. 2002. FSTAT, a program to estimate and test gene diversities and fixation indices (version 2.9.3.2). Department of Ecology & Evolution, University de Lausanne, Lausanne. Retrieved May 13, 2011, from: http://www.unil.ch/izea/softwares/fstat.html |
| 16. |
Hamrick , J. L. & Godt, M. J. W. 1989. Allozyme diversity in plant species. In: Brown, A. H. D., Clegg, M. T., Kahler, A. L. & Weir, B. S. (Eds.), Plant population genetics, breeding and genetic resources. Sinauer, Sunderland: 43–63. |
| 17. |
Hamrick, J. L. & Godt, M. J. W. 1996. Conservation genetics of endemic plant species. In: Avise, J. C. & Hamrick, J. L. (Eds.), Conservation genetics. Chapman & Hall, New York: 281–304. https://doi.org/10.1007/978-1-4757-2504-9_9 |
| 18. |
Hardy, O. J. & Vekemans, X. 2002. SPAGeDi: a versatile computer program to analyze spatial genetic structure at the individual or population level. Molecular Ecology Notes 2: 618–620. https://doi.org/10.1046/j.1471-8286.2002.00305.x |
| 19. |
IUCN (International Union for Conservation of Nature) 2001. IUCN Red List Categories: Version 3.1. IUCN, Gland & Cambridge. |
| 20. |
Kim, I. R., Yu, D. & Choi, H.-K. 2015. AFLP 마커를 이용한 조릿대 개체군의 식물지리학적 연구 [A phytogeographical study of Sasa borealis populations based on AFLP analysis]. Korean Journal of Plant Taxonomy 45: 29–35 [in Korean]. https://doi.org/10.11110/kjpt.2015.45.1.29 |
| 21. |
Kim, Y.-S., Kim, H. & Son, S.-W. 2016. Sophora koreensis. The IUCN Red List of Threatened Species 2016: e.T13188557A13189529. Retrieved December 5, 2016, from https://doi.org/10.2305/IUCN.UK.2016-1.RLTS.T13188557A13189529.en |
| 22. |
Kim, Z. S., Hwang, J. W., Lee, S. W., Yang, C. & Gorovoy, P. G. 2005. Genetic variation of Korean pine (Pinus koraiensis Sieb. et Zucc.) at allozyme and RAPD markers in Korea, China and Russia. Silvae Genetica 54: 235–246. |
| 23. |
Langella, O. 1999. Populations version 1.2.30. Retrieved August 14, 2013, from http://bioinformatics.org/~tryphon/populations/ |
| 24. |
Lee, J.-Y., Lee, D.-H. & Choi, B.-H. 2012. Isolation and characterization of 13 microsatellite loci from a Korean endemic species, Sophora koreensis (Fabaceae). International Journal of Molecular Sciences 13: 10765–10770. https://doi.org/10.3390/ijms130910765 |
| 25. |
Lee, W. K., Toru, T. & Heo, K. 2004. Molecular evidence for inclusion of the Korean endemic genus “Echinosophora” in Sophora (Fabaceae), and embryological features of the genus. Journal of Plant Research 117: 209–219. https://doi.org/10.1007/s10265-004-0150-x |
| 26. |
Lee, W. T. 1996. 한국식물명고 [Standard illustrations of Korean plants]. Academy Publishing Co., Seoul [in Korean]. |
| 27. |
Liu, Z.-M., Zhao, A.-M., Kang, X.-Y., Zhou, S.-L. & López-Pujol, J. 2006. Genetic diversity, population structure, and conservation of Sophora moorcroftiana (Fabaceae), a shrub endemic to the Tibetan Plateau. Plant Biology 8: 81–92. https://doi.org/10.1055/s-2005-872889 |
| 28. |
Mitton, J. B., Linhart, Y. B., Sturgeon, K. B. & Hamrick, J. L. 1979. Allozyme polymorphisms detected in mature needle tissue of ponderosa pine. Journal of Heredity 70: 86–89. |
| 29. |
MOE (Ministry of Environment, Republic of Korea) 2012. 한국의 멸종위기 야생동∙식물 적색자료집 관속식물 [Red data book of endangered vascular plants in Korea]. National Institute of Biological Resources, Incheon [in Korean]. |
| 30. |
Nei, M. 1973. Analysis of gene diversity in subdivided populations. Proceedings of the National Academy of Sciences of the United States of America 70: 3321–3323. https://doi.org/10.1073/pnas.70.12.3321 |
| 31. |
Nei, M. 1978. Estimation of average heterozygosity and genetic distance from a small number of individuals. Genetics 89: 583–590. |
| 32. |
Nei, M., Tajima, F. & Tateno, Y. 1983. Accuracy of estimated phylogenetic trees from molecular data. II. Gene frequency data. Journal of Molecular Evolution 19:153–170. https://doi.org/10.1007/bf02300753 |
| 33. |
Oh, B. U., Han, J. W., Yang, S. K., Jang, E. S., Jang, C. G., Kim, Y. Y. & Kang, S. H. 2009. 강원도 양구군 특산식물 개느삼(콩과) 자생지 내의 식물상과 식생 – 양구군 남면 죽곡리, 황강리를 중심으로 [Flora and vegetation in a habitat of Echinosophora koreensis (Nakai) Nakai (Leguminosae), a Korean endemic plant in Yanggu-gun (Kangwon), Korea–Focused on Jukgok-ri and Hwanggang-ri]. Journal of the Korea Society of Environmental Restoration Technology 12: 19–28 [in Korean]. |
| 34. |
Page, R. D. M. 1996. TreeView: an application to display phylogenetic trees on personal computers. Computer Applications in the Bioscience 12: 357–358. |
| 35. |
Peakall, R. & Smouse, P. E. 2006. GenAlEx 6: genetic analysis in Excel. Population genetic software for teaching and research. Molecular Ecology Notes 6: 288–295. https://doi.org/10.1111/j.1471-8286.2005.01155.x |
| 36. |
Quick, Z. I., Houseman, G. R. & Büyüktahtakin, I. E. 2017. Assessing wind and mammals as seed dispersal vectors in an invasive legume. Weed Research 57: 35–43. https://doi.org/10.1111/wre.12232 |
| 37. |
Ra, U. C., Park, H.-S., Ju, I.-Y. et al. 2005. Red data book of DPR Korea (plant). MAB National Committee of DPR Korea, Botanical Institute, Biological Branch, Academy of Sciences, Pyongyang. |
| 38. |
Rousset, F. 1997. Genetic differentiation within and between two habitats. Genetics 151: 397–407. |
| 39. |
Schnabel, A. & Hamrick, J. L. 1990. Organization of genetic diversity within and among populations of Gleditsia triacanthos (Leguminosae). American Journal of Botany 77: 1060–1069. https://doi.org/10.2307/2444577 |
| 40. |
Soltis, D. E., Haufler, C. H., Darrow, D. C. & Gastony, G. J. 1983. Starch gel electrophoresis of ferns: a compilation of grinding buffers, gel and electrode buffers, and staining schedules. American Fern Journal 73: 9–27. https://doi.org/10.2307/1546611 |
| 41. |
Weir, B. S. & Cockerham, C. C. 1984. Estimating F-statistics for the analysis of population structure. Evolution 38: 1358–1370. https://doi.org/10.2307/2408641 |
| 42. |
Williams, C. F. 1994. Genetic consequences of seed dispersal in three sympatric forest herbs. II. Microspatial genetic structure within populations. Evolution 48: 1959–1972. https://doi.org/10.2307/2410520 |
| 43. |
Williams, C. F. & Guries, R. P. 1994. Genetic consequences of seed dispersal in three sympatric forest herbs. I. Hierarchical population genetic structure. Evolution 48: 791–805. https://doi.org/10.2307/2410487 |
| 44. |
Wright, S. 1965. The interpretation of population structure by F-statistics with special regard to systems of mating. Evolution 19: 395–420. https://doi.org/10.2307/2406450 |
| 45. |
Yeh, F. C., Yang, R. C. & Boyle, T. B. J. 1999. POPGENE. Version 1.31. Microsoft Windows-based free ware for population genetic analysis. Department of Renewable Resources, University of Alberta, Edmonton. Retrieved March 12, 2011, from http://www.ualberta.ca/~fyeh/index/htm |
| 46. |
Yim, K.-B. 1993. 천연기념물: 식물편 [Botanical treasures (natural monuments) of Korea]. Daewonsa, Seoul [in Korean]. |